Inputting Data into Texas A&M Farm Bill Decision Tool
Last week was enjoyable working with farmers on Farm Bill decisions. I’ve decided to work with producers on an individual basis. If you are interested in help looking at your potential options using the Texas A&M model or would like another set of eyes to make sure the data was inputted correctly, please call (402) 762-3644 and Deanna or Holli will get you scheduled for a time.
One caveat is that this model is only as good as the data you input into it and your decisions

Example of FSA “eraser sheet” courtesy of Randy Pryor, Nebraska Extension in Saline County.
are based on where you feel potential prices the next five years will be. You need your CC yields and base acres from FSA as well as production history since at least 2008 (2003 if you wish to run crop insurance tool). Requesting a copy of the FSA “eraser sheet” is a great tool to check on planted and crop production planted acres and to see if reallocated base jives with the computer program. The Texas A&M simulation at https://usda.afpc.tamu.edu/ isn’t difficult to run, but it can be confusing as to what number to input where. Begin by registering at the site by providing an email address and password. Then login and you will see the following screen.
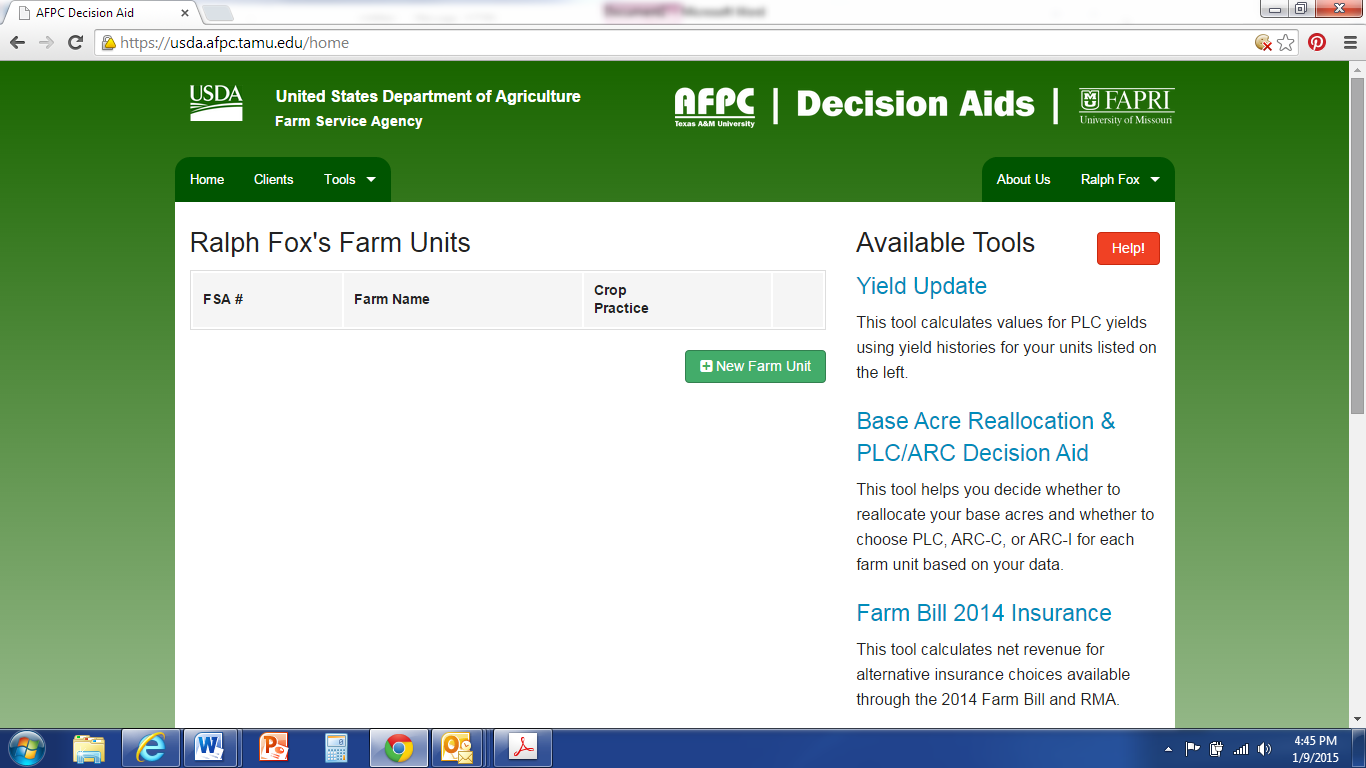
It is important for you to decide what you want the tool to analyze for you. It can analyze: yield update, base reallocation, ARC vs. PLC, and crop insurance (shown in right-hand column in screen-shot, or can also be selected from “Tools” in top drop-down menu). If you want to analyze crop insurance decisions, EACH crop insurance tract needs to be entered as a “new farm unit” under each FSA farm number. It takes a lot of time and it can be done, but that’s the only way to use this tool to also look at crop insurance including supplemental coverage option (SCO).
If you do not want to look at crop insurance decision but wish to consider the first three decisions, then for counties such as Clay County with COMBINED irrigated and dryland county yields, completing the Price Loss Coverage (PLC) Yield Worksheet (CCC-859) from FSA with your combined irrigated and dryland yields for each FSA number will greatly aid you in inputting the data. For counties with any splits in irrigated and dryland yields, I recommend placing irrigated and dryland production separately on the top of the PLC Yield worksheet, and then combining production by crop towards the bottom of the worksheet. Regardless of if your county has the opportunity for a split irrigated/non-irrigated payment, all CC yields in Nebraska are combined by crop (regardless of irrigation or not), so FSA will want a combined yield by crop on their form.
EACH crop needs to be entered as a separate farm unit. I have created a fake account to walk you through a simulation.
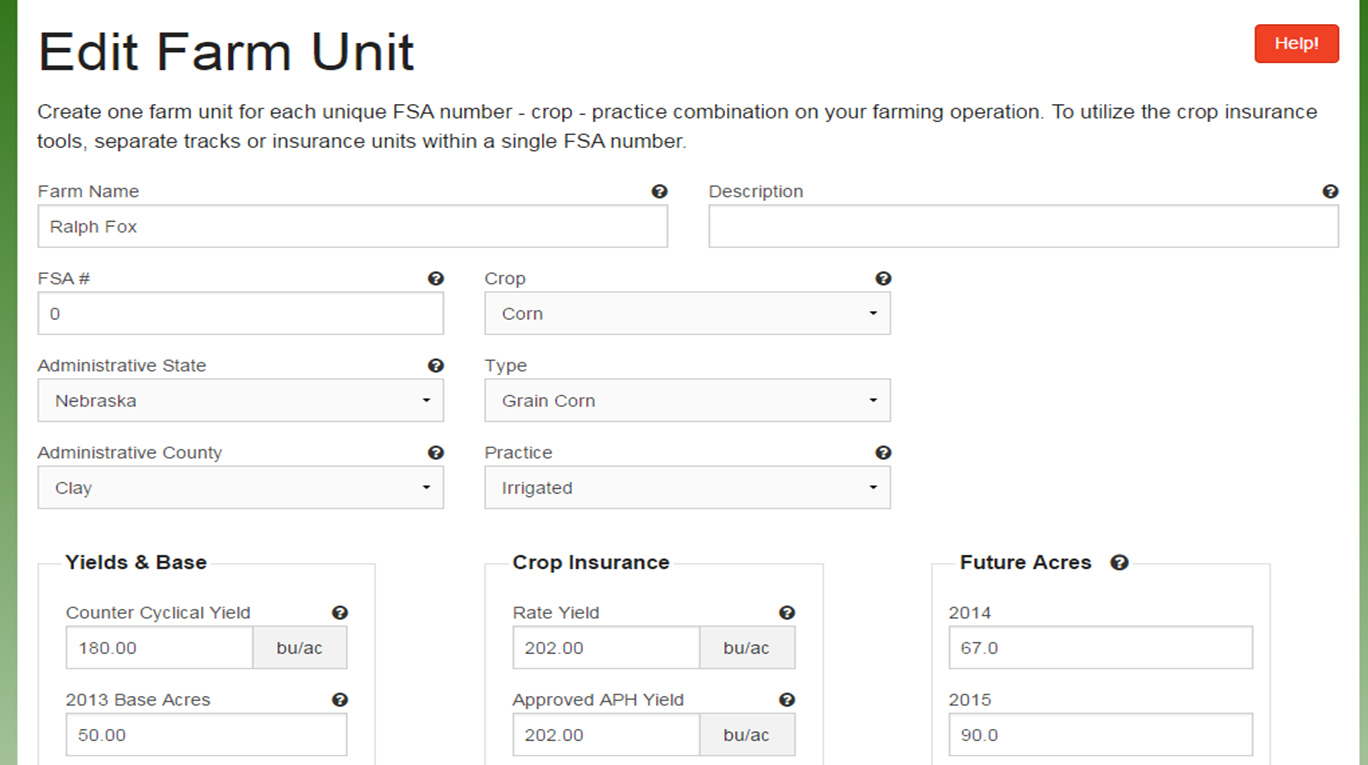
Some are having a difficult time finding “rate yield” on their crop insurance forms. It is not critical if you are not using the crop insurance tool and the same Approved APH yield can be inputted for the rate yield as well. If using the crop insurance tool, the correct rate yield from crop insurance must be used. UPDATE: If you ARE NOT interested in analyzing crop insurance information, “0” can be inserted for basis price, rate and APH yields, and select “none” for crop insurance. If you are also not interested in analyzing ARC-IC, then “future acres” can also be entered as “0”.
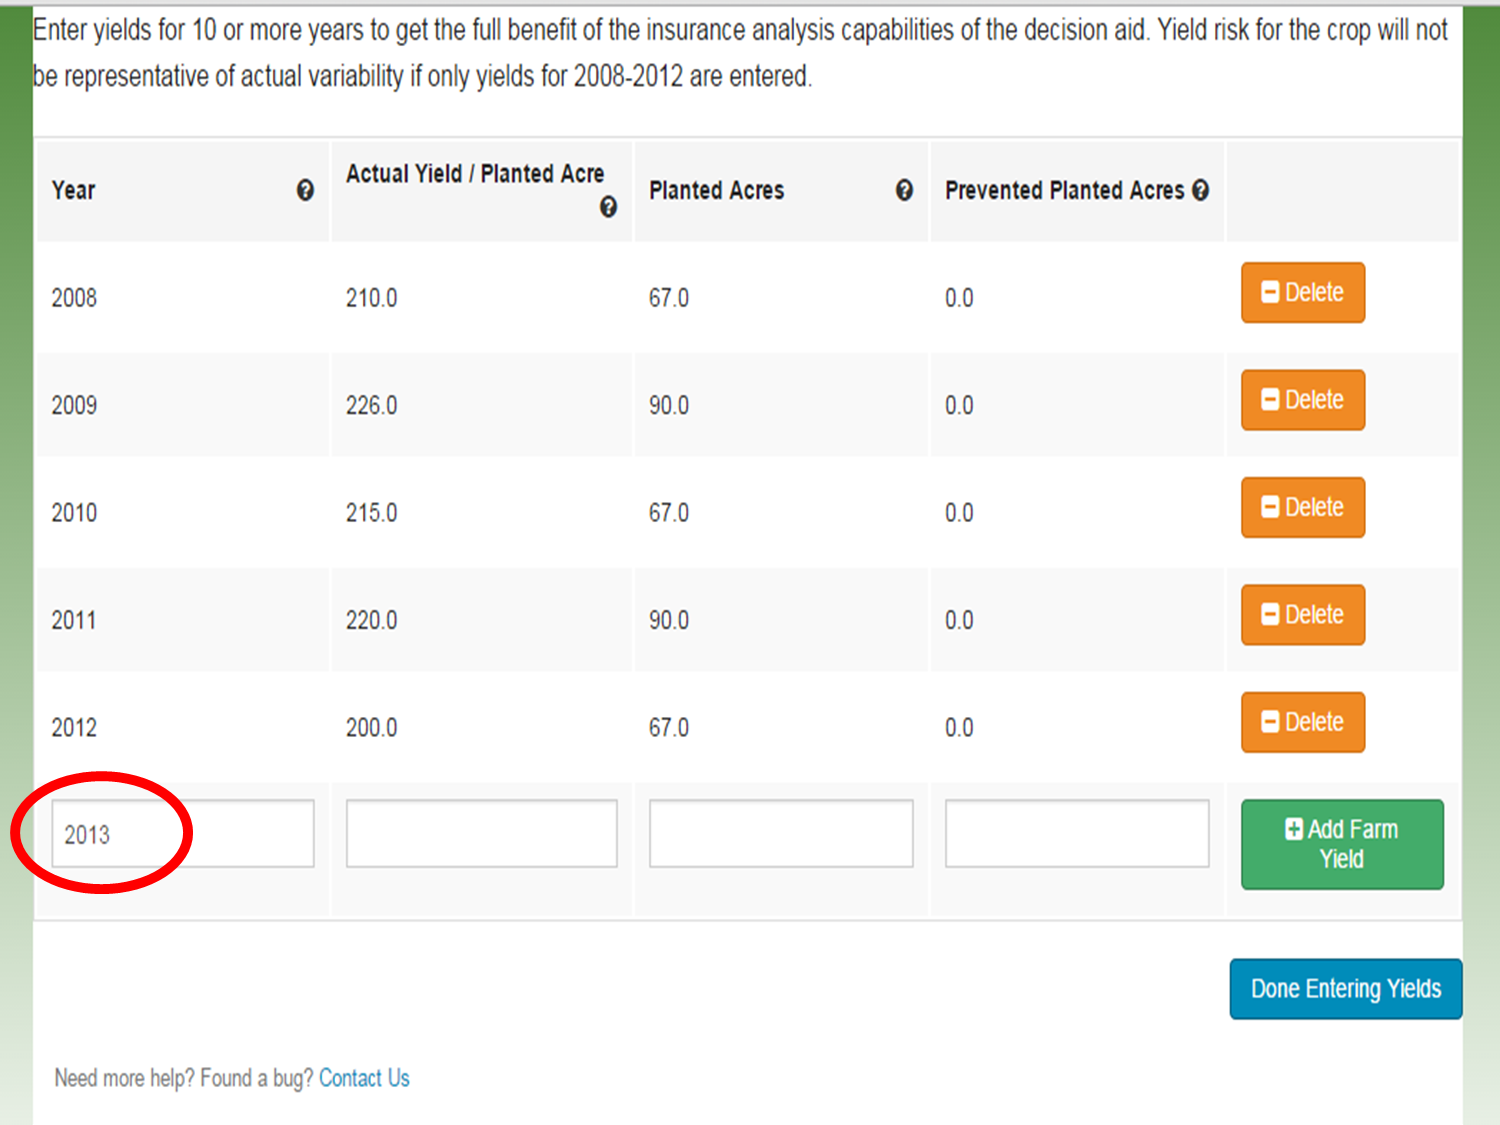
When entering yields, you need to enter one more date after all your yield data has been entered for the data to save properly. In this example, I have inputted yield data for 2008-2012. I then added “2013” and pressed “save yield data”. If you input 2013 yields, be sure to add a “2014” instead. Not doing this step will delete your last row of yield information.

Notice that each crop needs to be added as a separate farm unit. If using the crop insurance tool, each crop insurance tract under each FSA farm number needs to be added as a separate farm unit. Be sure to split out base acres among the tracts and be sure that the total base acres add up to the total base acres from FSA.
For entering separate crop insurance tracts, the CC yield should remain the same for all dryland tracts under one FSA farm number (same for irrigated). However, you will have to split out base acres amongst the tracts and you need to make sure the acres inputted add up; please double check this!
For your yield update and base reallocation information: For some of you, the base reallocation acres in the tool have been slightly different than what you received from FSA office. That may be because risk management agency (RMA) acres were used and were different than the production acres FSA had on file. You need to use the FSA acres for planted acres when using this model if they differ from the RMA ones.
When running this model, on many farms PLC + SCO looks favorable for some crops. A word of caution, you can consider PLC but should not consider SCO in your decision if you have not broken everything out into crop insurance tracts and included 10 years of production history into the tool. So in the decision of reallocating base acres or not, in the final summary section that gives you total numbers, anytime PLC+SCO is shown for a particular crop and you have not included the proper crop insurance info, you need to re-calculate the final total by hand using PLC ONLY from the table above that area. It normally doesn’t change the outcome that the decision tool provides, but it can. I’m not saying that SCO shouldn’t be considered, what I’m saying is that the numbers provided in the tool are not accurate if you have not inputted the data in the way needed to look at crop insurance decisions.

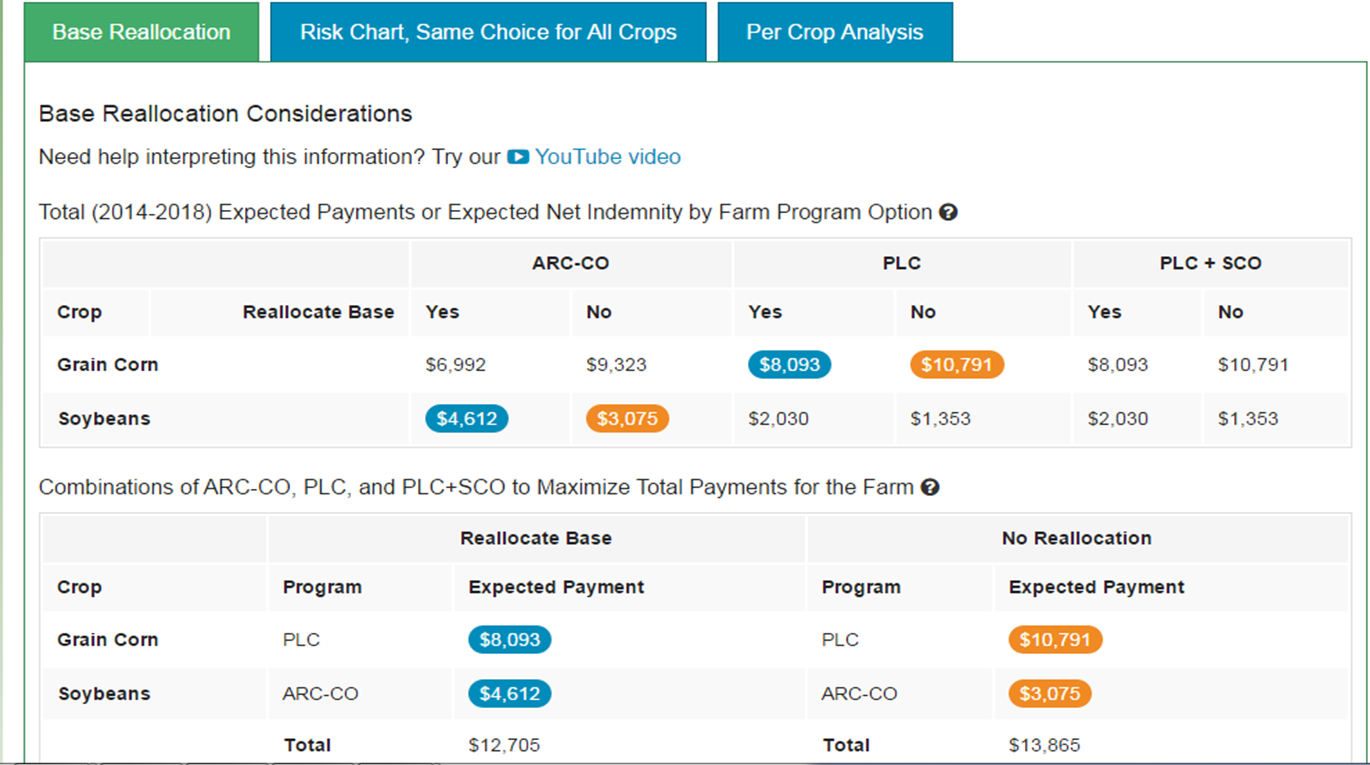
In this example, you notice three tabs: Base reallocation, risk chart, and per crop analysis. The green tab shows what you are looking at-in this case base reallocation. Notice there are two charts: The top one shows ARC-Co, PLC, and PLC+SCO. Blue circles indicate best option with reallocating base acres while orange circles indicate best option without reallocating base acres. The second table gives you your totals. Notice in this table and the one above that PLC+SCO are shown as the best options for corn. However, in the total, because we did not separate the crop insurance tracts in this FSA farm number and because I didn’t include 10 years of yield data, I need to recalculate the totals by looking at the top table for the next highest prices under ARC and PLC. So for this example, to refigure best reallocation of base payment total, I would take the $8093 listed in PLC, reallocation for corn since it is higher than ARC and add it to the $4612 for soybean payment to get: $12,705 for base reallocation. For no base reallocation, I would add $10,791 from PLC since higher than ARC in this example and add it to $3075 to get a total of $13,866 for no base reallocation. Most of the time, the outcome stays the same, but there are a couple instances it has changed, so wanted to make you aware of the importance of this.
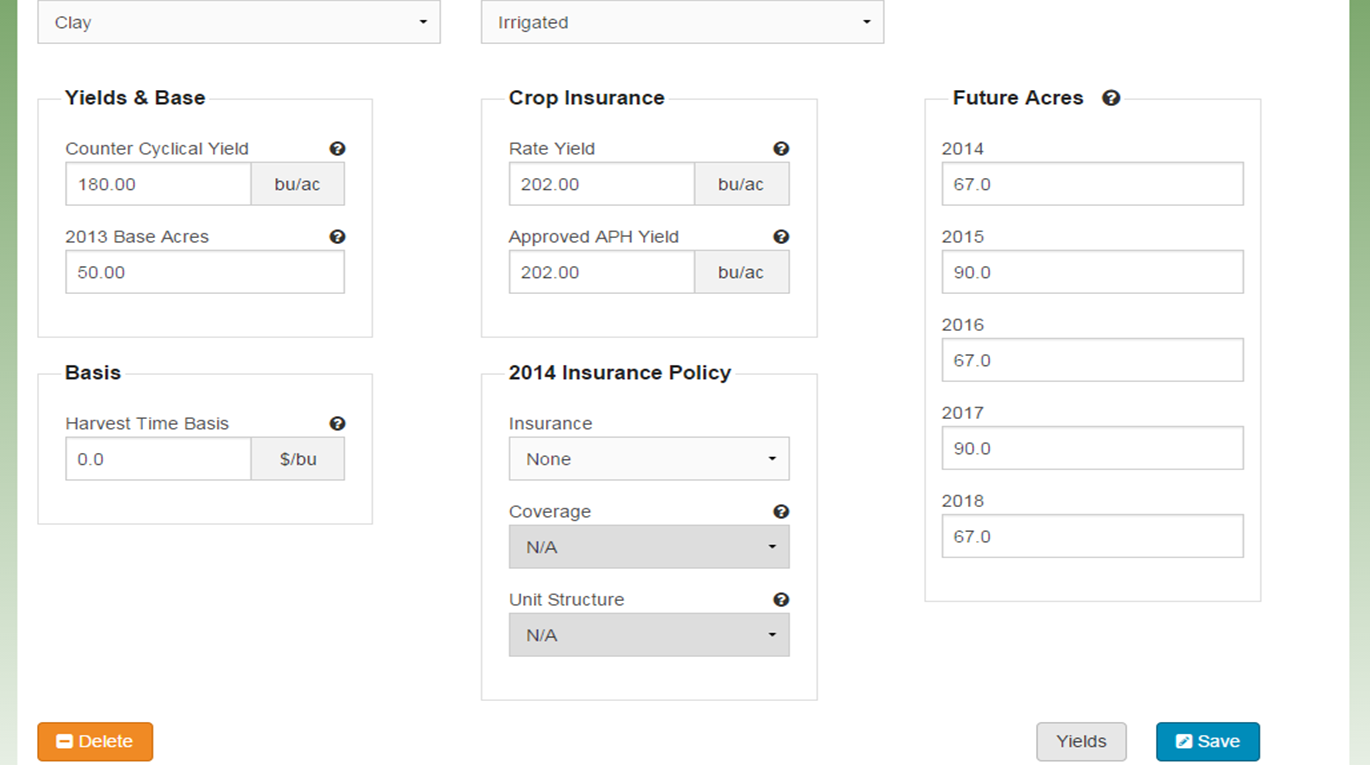
Or to get around having to hand-calculate removing SCO from the total decisions, Randy Pryor and Paul Hay, Nebraska Extension in Saline and Gage Counties respectively, discovered that if you select “no crop insurance policy” on the edit screen for each farm unit, that it automatically takes out adding SCO into your final calculated options as you can see from the next screenshot!
When not adding crop insurance tract info and 10 year yield history information to be able to analyze Supplemental Coverage Option (SCO), removing crop insurance from the beginning edit screens allows you to analyze base reallocation and ARC-Co vs. PLC program options without having to recalculate and remove SCO. It won’t give you a higher SCO payment number when adding information in this way.
Some of you have questioned why PLC even lists a payment when prices are inputted higher than the benchmark price of $3.70 for corn, etc. The Texas A&M tool is giving you essentially a bell curve of 500 random outputs with the distribution of that curve around the particular price you input for each crop. So with every given price you input, there’s a certain probability that the price will be at, above, or below that particular price. That’s essentially what the red, green, yellow bars are showing you on the analysis. So you’re assessing where you feel prices will be, what decision will allow you to best sleep at night, the potential of spreading out risk with several farm numbers by choosing different options, etc. You can also view the YouTube videos from Texas A&M with more information!

Posted on January 12, 2015, in Farm Bill and tagged Extension, farm, farm bill, farm bill decision tools, farming, Nebraska, Texas A&M farm bill tool. Bookmark the permalink. 2 Comments.


Pingback: Additional Farm Bill Decision Tool Information | JenREESources's Extension Blog
Pingback: Simplification and Accuracy in Texas A&M Farm Bill Decision Tool | JenREESources's Extension Blog